
Tuesday, August 27, 2019
Are we really burning?
Listening to a 1947 episode of 'Man called X'. Despite the name, the series was more like a regular cop show than a foreign spy show.
This episode deals with a Federally sponsored sawmill in Oregon (unthinkable now!!!!!!) that was being ruined by some kind of protection racket.
In the intro the announcer says:
"Did you know that every year over the US, forest fires burn an area equal to New England?"
Sounds a lot like the crap we hear every day now.
Was it true then?
New England is 72000 sqmi.
Using data from NIFC, the total burned in 1947 was 36k square miles, half of New England.
The announcer may have been obliquely referring to a specific event in 1947: Maine suffered from a major outbreak of fires that burned a significant part of the state. But that's not what he actually said.
Here's the long-term pattern:
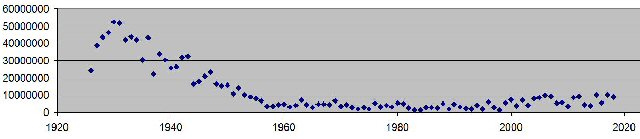 (XLS here.)
Overall, we've been a LOT less burny since 1952. The total is creeping up in the last
20 years:
(XLS here.)
Overall, we've been a LOT less burny since 1952. The total is creeping up in the last
20 years:
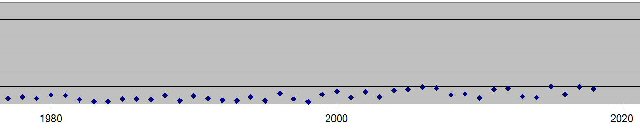 but not dramatically. The "endangered" "species" act was passed by progressive hero (heh) Nixon
in 1973, and got really serious under progressive hero (heh) Reagan in 1982. The fires seemed
to reach a new baseline on the graph in 1992. Typical annual mileage in recent years is about 10k sqmi, 1/3 of the 1947 total.
Let's compare the fires with annual precipitation for the western third of the country, where most fires burn.
but not dramatically. The "endangered" "species" act was passed by progressive hero (heh) Nixon
in 1973, and got really serious under progressive hero (heh) Reagan in 1982. The fires seemed
to reach a new baseline on the graph in 1992. Typical annual mileage in recent years is about 10k sqmi, 1/3 of the 1947 total.
Let's compare the fires with annual precipitation for the western third of the country, where most fires burn.
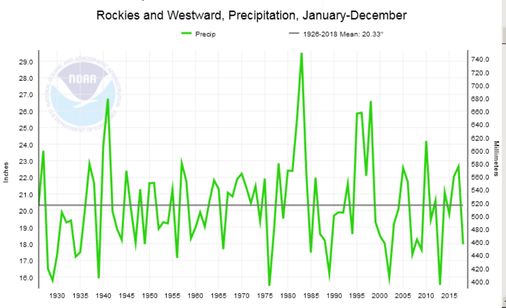 Aha! Just like the media says! It's a straight line downward! We're getting DRYER AND DRYER EVERY ... oops. There's no pattern, no trend, no correlation to the wildfire graph.
Simple and UNDENIABLE conclusion: Fires vary with a complex combination of spring rains and summer droughts. They MOSTLY vary with forest management practices, and with arson and powerlines and cigarettes and transient campfires and railroad hotboxes and so on. The variation is mainly human-caused, but it has ZERO connection to "global warming", whatever the fuck that means.
Turns out old Smokey was precisely correct.
Aha! Just like the media says! It's a straight line downward! We're getting DRYER AND DRYER EVERY ... oops. There's no pattern, no trend, no correlation to the wildfire graph.
Simple and UNDENIABLE conclusion: Fires vary with a complex combination of spring rains and summer droughts. They MOSTLY vary with forest management practices, and with arson and powerlines and cigarettes and transient campfires and railroad hotboxes and so on. The variation is mainly human-caused, but it has ZERO connection to "global warming", whatever the fuck that means.
Turns out old Smokey was precisely correct.


(XLS here.)
Overall, we've been a LOT less burny since 1952. The total is creeping up in the last
20 years:
but not dramatically. The "endangered" "species" act was passed by progressive hero (heh) Nixon
in 1973, and got really serious under progressive hero (heh) Reagan in 1982. The fires seemed
to reach a new baseline on the graph in 1992. Typical annual mileage in recent years is about 10k sqmi, 1/3 of the 1947 total.
Let's compare the fires with annual precipitation for the western third of the country, where most fires burn.
Aha! Just like the media says! It's a straight line downward! We're getting DRYER AND DRYER EVERY ... oops. There's no pattern, no trend, no correlation to the wildfire graph.
Simple and UNDENIABLE conclusion: Fires vary with a complex combination of spring rains and summer droughts. They MOSTLY vary with forest management practices, and with arson and powerlines and cigarettes and transient campfires and railroad hotboxes and so on. The variation is mainly human-caused, but it has ZERO connection to "global warming", whatever the fuck that means.
Turns out old Smokey was precisely correct.
Labels: Answered better than asked, Carbon Cult
¶ 1:42 AM