
Tuesday, March 05, 2013
1938 again
Polistra has been asking about the conventional understanding of the 1938 "second depression". Most leftists follow the Krugmanite insult to Keynes, insisting that FDR didn't borrow enough and "stimulate" enough to keep a recovery going. In the previous episode, we found clues that the real problem was bankers going on strike in response to stiff regulations.
Here are a few tables from the 1939 Statistical Abstract that cast more light on the "re-depression". Still no decisive evidence one way or the other.
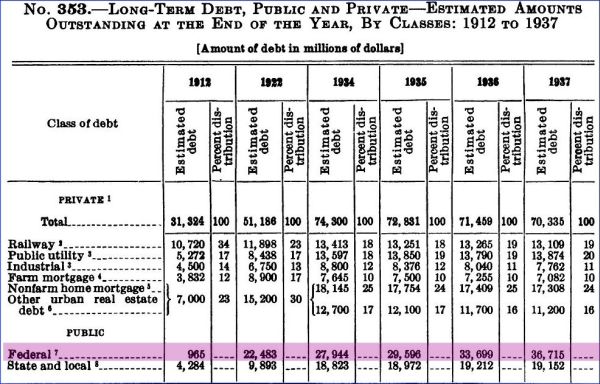
First, look at national debt. FDR increased the debt steadily by 3 billion each year, which is about 50 billion in modern dollars. No difference between '36 and '37 here, no "failure to borrow". (Incidentally, can you imagine a modern president adding only 50 billion to the debt? Physically impossible.)
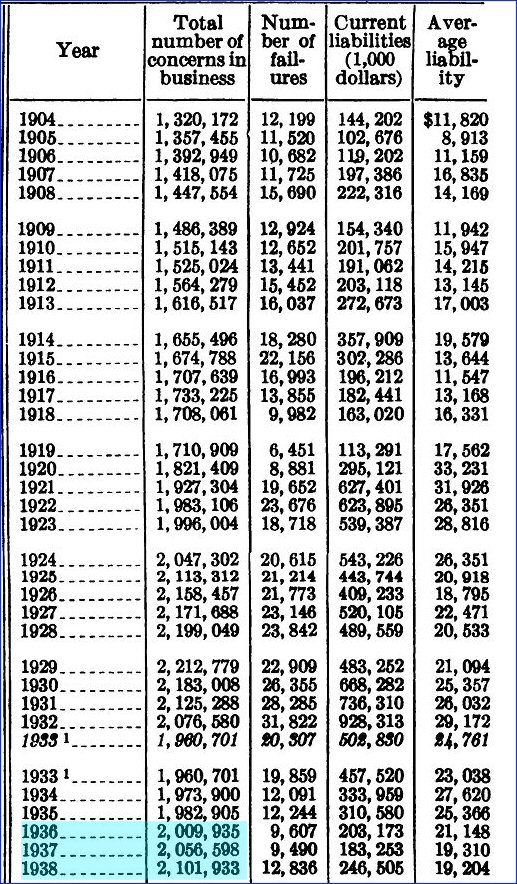
 Next a table of 'firms in business' and business failures. Nothing special in '38 here.
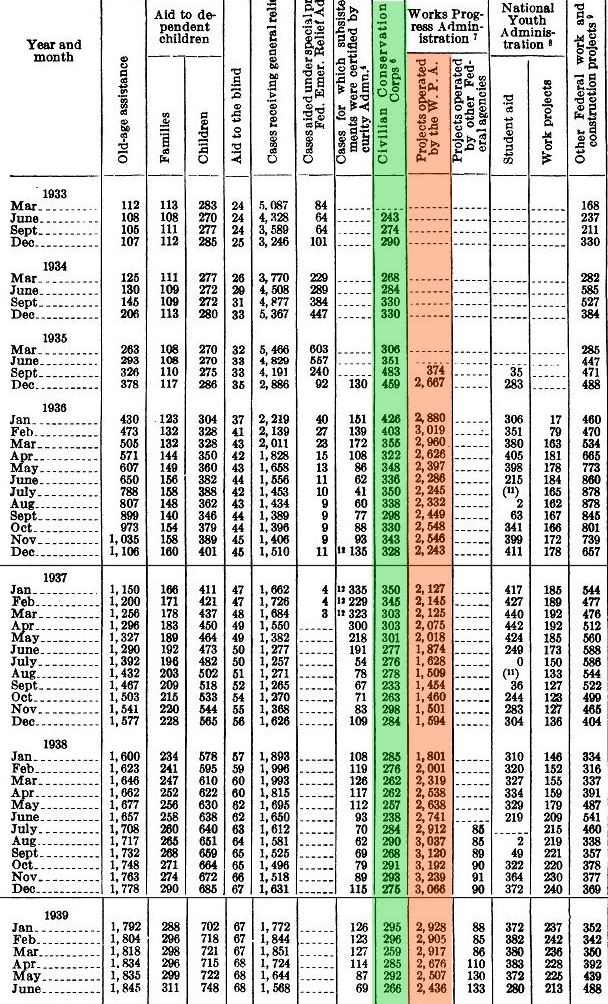
 How about WPA and CCC? Those were the main conduits for "stimulus". This table shows thousands of participants. CCC highlighted in green, WPA in red. CCC held steady during this time. WPA went down in '37 because the economy was improving, then back up in '38 to compensate for the decline. Doesn't look like "failure to stimulate", and the families who needed the WPA weren't going to buy a new car in any case.
 Next a table of total wages. Note the highlighted row of wages indexed to pre-crash 1929. It looks like '37 was an outlying positive blip, with '38 returning to slightly above '36.
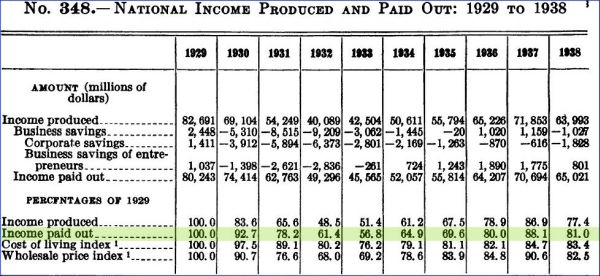 Finally a more detailed table of income. Same picture: fallback from '37, but still above '36.
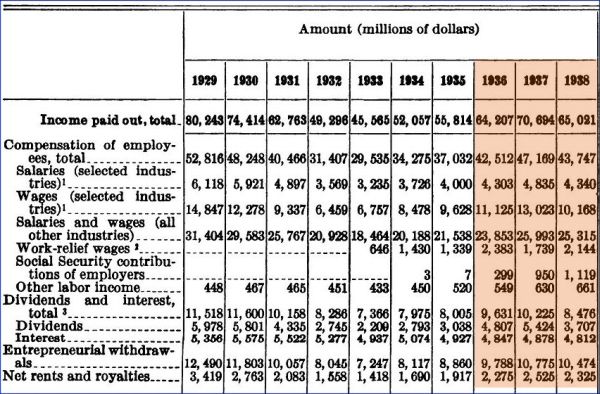 None of this would seem to account for the cut-in-half auto production. Banks halting loans would explain it.
¶ 4:06 AM
None of this would seem to account for the cut-in-half auto production. Banks halting loans would explain it.
¶ 4:06 AM 

Next a table of 'firms in business' and business failures. Nothing special in '38 here.
How about WPA and CCC? Those were the main conduits for "stimulus". This table shows thousands of participants. CCC highlighted in green, WPA in red. CCC held steady during this time. WPA went down in '37 because the economy was improving, then back up in '38 to compensate for the decline. Doesn't look like "failure to stimulate", and the families who needed the WPA weren't going to buy a new car in any case.
Next a table of total wages. Note the highlighted row of wages indexed to pre-crash 1929. It looks like '37 was an outlying positive blip, with '38 returning to slightly above '36.
Finally a more detailed table of income. Same picture: fallback from '37, but still above '36.
None of this would seem to account for the cut-in-half auto production. Banks halting loans would explain it.
¶ 4:06 AM 